
Peak sun hours by state: the December number that sizes an off-grid system
Every solar map ranks states by their yearly average. An off-grid home has to get through its darkest month instead, and on that measure the order changes, sometimes dramatically.
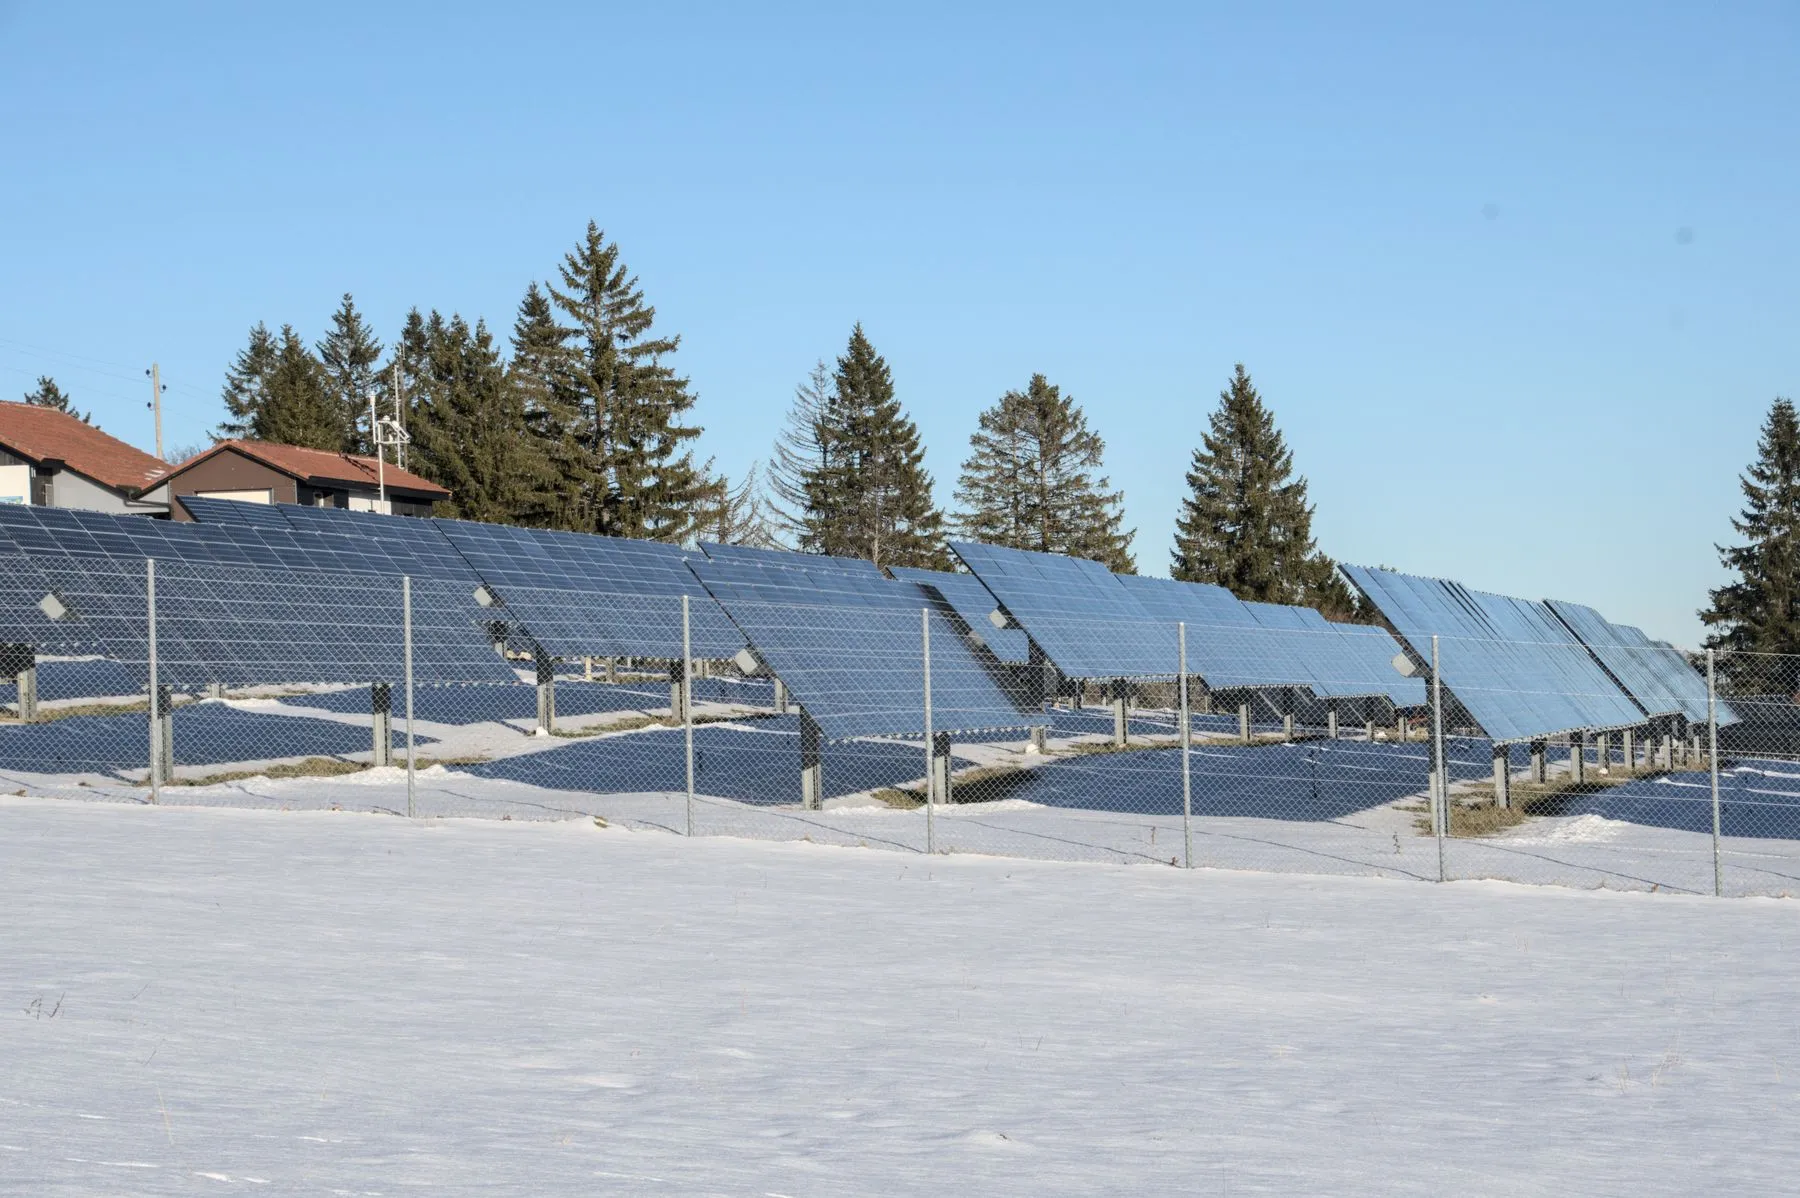
Idaho ranks 21st of the 50 states for annual solar energy where its residents live. Rank the same places by December, the month an off-grid battery bank has to survive, and Idaho falls to 43rd, behind Iowa. Utah drops from 7th to 20th. Wyoming drops from 9th to 22nd. Meanwhile Florida climbs into the top five and Hawaiʻi takes first place.
Those numbers come from 25 years of NASA satellite-derived solar data (2001–2025), pulled for one point in each state and compared two ways: the annual average every solar map shows, and the darkest month. A grid-tied home can bank July’s surplus with the utility and draw it back in December. An off-grid home cannot. Its panels, batteries and generator have to work in the worst month, so the worst month is the number that sizes the system.
What a peak sun hour measures
A peak sun hour is one kilowatt-hour of sunlight falling on one square meter. It is the energy a surface would receive in one hour of strong midday sun at 1,000 watts per square meter, the intensity at which solar panels are rated. A summer day in Arizona may deliver seven or more. A cloudy December day in western Washington may deliver less than one, even with eight hours of daylight.
Because panels are rated at that same intensity, the arithmetic is simple. A 400-watt panel receiving 3 peak sun hours produces about 1,200 watt-hours before losses. Our solar calculator applies a 75% delivery factor for heat, wiring, dirt and charging losses, so 3 hours becomes about 900 watt-hours.
The figures here are NASA POWER’s SI_TILTED_AVG_LATITUDE values: energy on a south-facing surface tilted at the site’s latitude, the standard starting point for a fixed off-grid array. Each state is measured at its 2020 Census center of population, the point around which its residents are balanced. That makes the comparison fair to where people actually live, but it is not a statewide average. Washington’s point, for example, falls in the Cascades east of Seattle, and a high desert, a foggy coast or a valley floor in the same state can differ from it by an hour or more.
Annual versus December in every state
Each line runs from the December figure (red) to the annual average (green), sorted by December. The longer the line, the more a system sized on the annual number will fall short in winter. December was the lowest month in every state.
- Hawaiʻi5.0 / 6.0 h
- New Mexico5.0 / 6.5 h
- Arizona4.9 / 6.5 h
- Florida4.5 / 5.3 h
- Nevada4.4 / 6.4 h
- Colorado4.3 / 5.5 h
- California4.1 / 6.2 h
- Texas4.0 / 5.1 h
- South Carolina3.8 / 5.0 h
- Oklahoma3.7 / 5.0 h
- Georgia3.7 / 4.9 h
- Louisiana3.7 / 4.9 h
- North Carolina3.6 / 4.9 h
- Kansas3.6 / 5.0 h
- Arkansas3.5 / 4.8 h
- Mississippi3.5 / 4.9 h
- Alabama3.5 / 4.8 h
- Virginia3.4 / 4.7 h
- Nebraska3.3 / 4.9 h
- Utah3.2 / 5.4 h
- Missouri3.2 / 4.7 h
- Wyoming3.2 / 5.3 h
- Tennessee3.1 / 4.6 h
- South Dakota3.0 / 4.8 h
- Iowa3.0 / 4.6 h
- Delaware3.0 / 4.5 h
- Maryland2.9 / 4.4 h
- Kentucky2.8 / 4.5 h
- New Jersey2.8 / 4.3 h
- Massachusetts2.7 / 4.3 h
- Rhode Island2.6 / 4.4 h
- Connecticut2.6 / 4.3 h
- North Dakota2.5 / 4.6 h
- West Virginia2.5 / 4.2 h
- Pennsylvania2.5 / 4.2 h
- Illinois2.5 / 4.3 h
- Maine2.5 / 4.2 h
- Montana2.5 / 4.6 h
- New Hampshire2.4 / 4.2 h
- New York2.4 / 4.1 h
- Wisconsin2.4 / 4.3 h
- Indiana2.4 / 4.3 h
- Idaho2.4 / 4.8 h
- Minnesota2.3 / 4.4 h
- Ohio2.0 / 4.0 h
- Michigan1.9 / 4.1 h
- Oregon1.9 / 4.3 h
- Vermont1.8 / 3.8 h
- Washington1.8 / 4.2 h
- Alaska0.5 / 2.9 h
Peak sun hours per day on a south-facing panel tilted at latitude, at each state’s 2020 center of population. Source: NASA POWER climatology 2001–2025. Download every state’s figures in the 50-state CSV.
Fall furthest when ranked by December
Rise furthest when ranked by December
- West Virginia — 44 → 34
- Massachusetts — 39 → 30
- Pennsylvania — 43 → 35
- Arkansas — 22 → 15
- New York — 46 → 40
- New Hampshire — 45 → 39
Why the order changes
Two things set winter solar energy: how high the sun climbs, and how often cloud gets in the way. Latitude controls the first. On the December solstice the noon sun stands about 39° above the horizon at Florida’s center of population and about 22° at Idaho’s. The lower the sun, the more atmosphere its light crosses and the shorter the day.
Cloud is the second. It explains why latitude alone does not predict the ranking. Montana’s population center sits about 6 degrees north of Ohio’s, yet Montana averages 2.5 hours in December and Ohio 2.0. Ohio sits under the persistent winter overcast that covers much of the Great Lakes region. Washington, Oregon, Michigan and Vermont share the same problem from different causes, and all four fall below 2 hours in December. Washington’s figure is less than a third of its June value.
The interior West is the surprise. Utah, Wyoming and Idaho rank near the top of annual solar maps because their summers are dry and bright. Their populated valleys are a long way north of Arizona, though, and they lose more of the year’s light in winter. Utah keeps only 60% of its annual average in December, against 78% for Texas and 85% for Florida. Colorado is the exception among mountain states. Its Front Range population center gets 4.3 December hours, more than Texas.
Then there is Alaska. At its center of population, between Anchorage and Wasilla, December delivers 0.5 peak sun hours a day, roughly a sixth of the state’s annual average. Off-grid homes there plan winter around generators, wood and stored fuel, with solar as a summer resource.
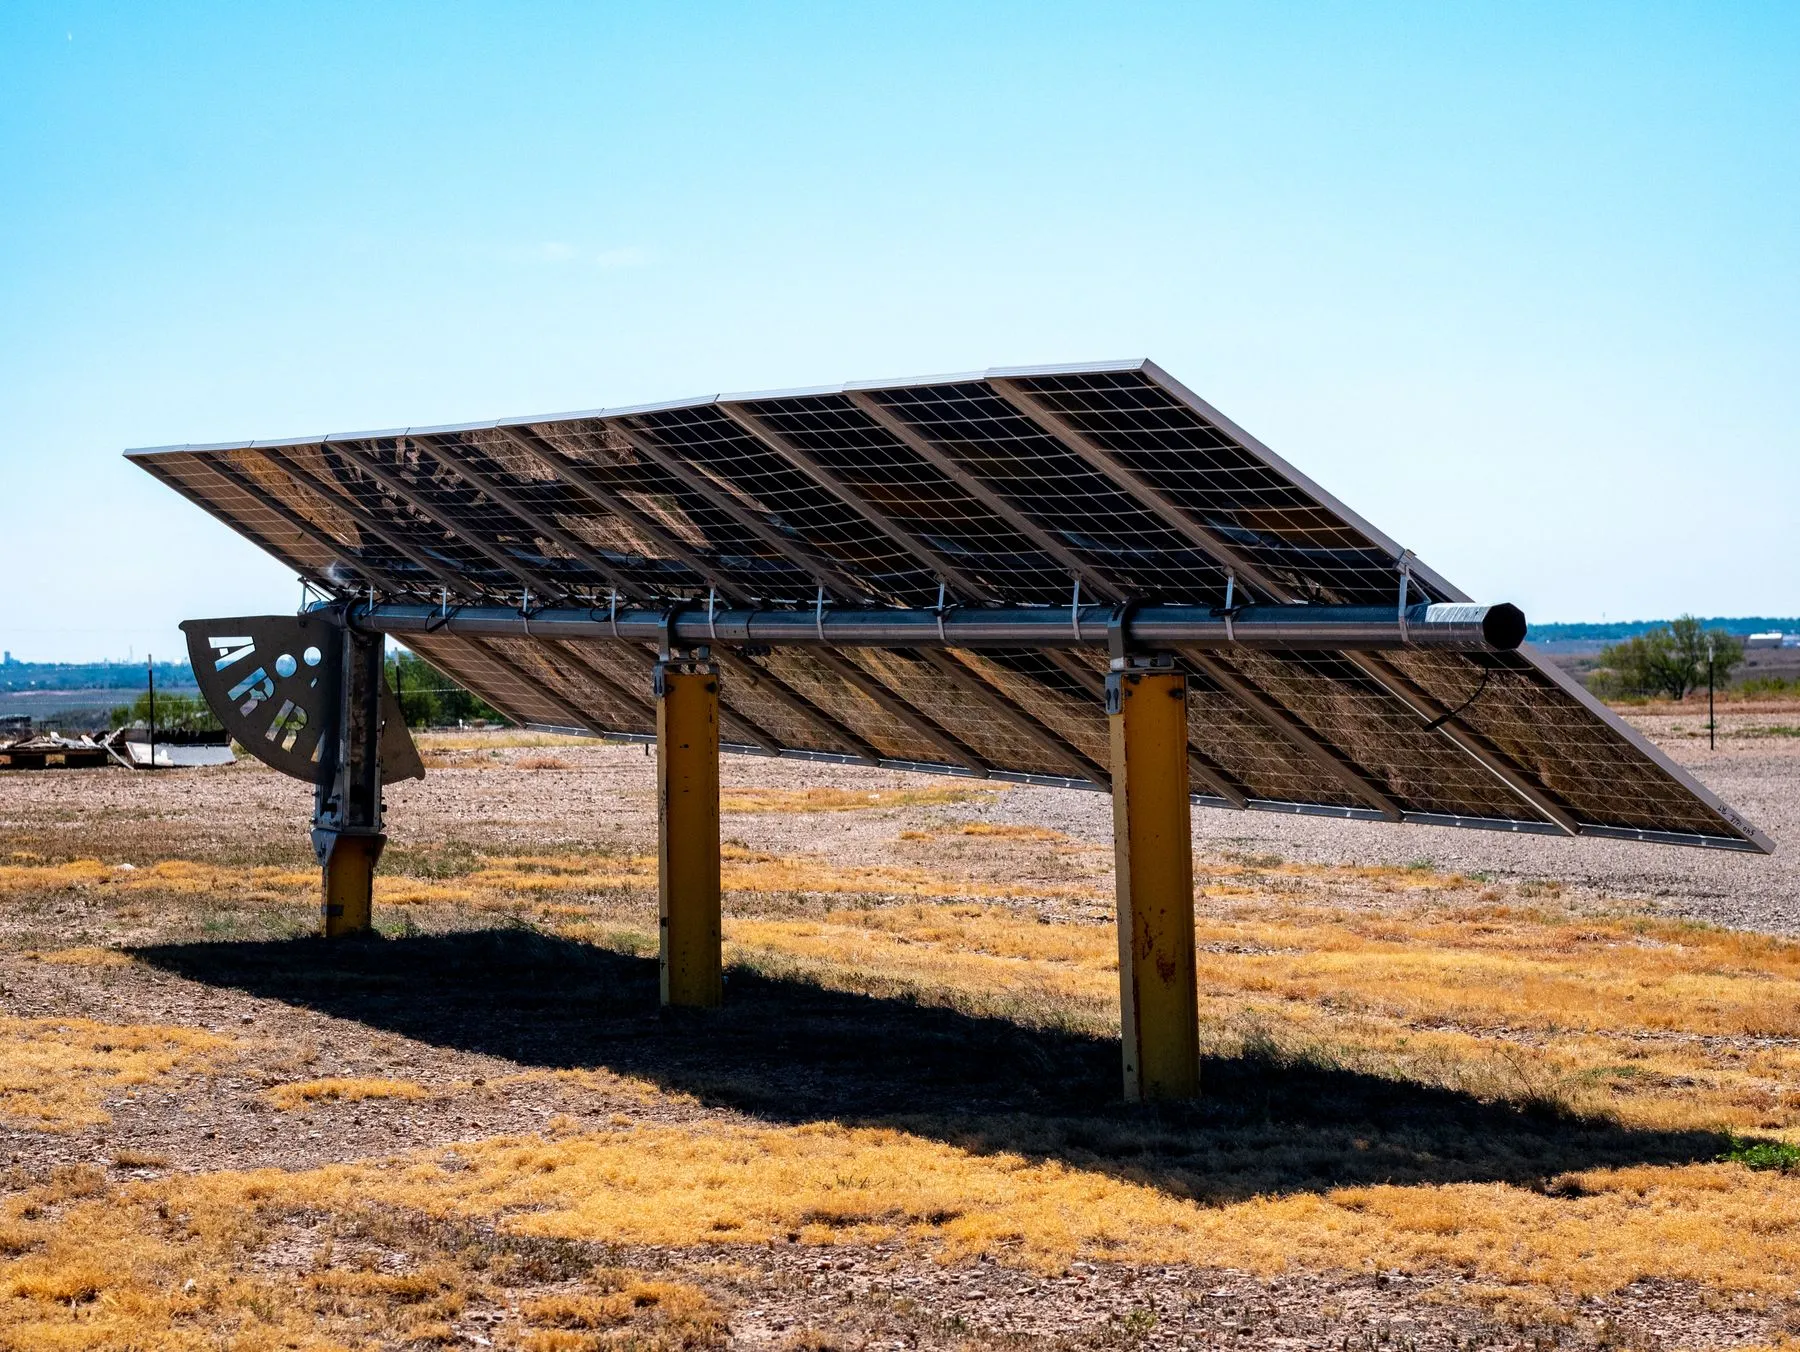
What it does to system size
Take a modest off-grid home that uses 5 kWh a day: an efficient refrigerator, lights, a well pump, a washing machine, laptops and a router. Size the array to replace one day’s use, with the calculator’s 75% delivery factor:
| State | Sized on annual average | Sized on December | Shortfall in December if sized on the average |
|---|---|---|---|
| Arizona | 1,020 W | 1,360 W | 25% |
| Colorado | 1,210 W | 1,560 W | 22% |
| Tennessee | 1,440 W | 2,120 W | 32% |
| Idaho | 1,390 W | 2,810 W | 50% |
| Washington | 1,580 W | 3,700 W | 57% |
In Arizona, designing for December adds about a third to the array. In Washington, it more than doubles it. That gap is why off-grid designers ask which months you intend to live on solar alone before they quote, and why a quote built on an annual production estimate is the wrong document for an independent home.
The battery is a separate question. It carries the house through nights and runs of cloudy days. December makes that harder in two ways: nights are longest, and cloudy spells are both longer and more frequent in the states at the bottom of the chart. Those are the same states where the array is already working hardest. Our solar planning guide explains how to set days of autonomy and test a designer’s assumptions.
Tilt, flat roofs and snow
Everything above assumes panels tilted at latitude and facing south. NASA’s data also shows what happens when they are not. A panel lying flat, as on most RV and van roofs, received a median of about 60% of a latitude-tilted panel’s December energy across the 50 population centers. In the northern states it was closer to half. At Washington’s population center, a flat panel collects about 0.9 December hours against 1.8 for a tilted one.
Going steeper than latitude helps less than people expect. A tilt 15° above latitude raised December output by a median of only about 6%, because so much winter light arrives as diffuse light from cloud rather than as a direct beam. The steeper angle earns its keep in snow country in another way: snow slides off it. A panel buried under snow produces almost nothing. NASA’s irradiance figures cannot account for that, and a regional dataset cannot see whether your panels clear in a day or stay buried for a week.
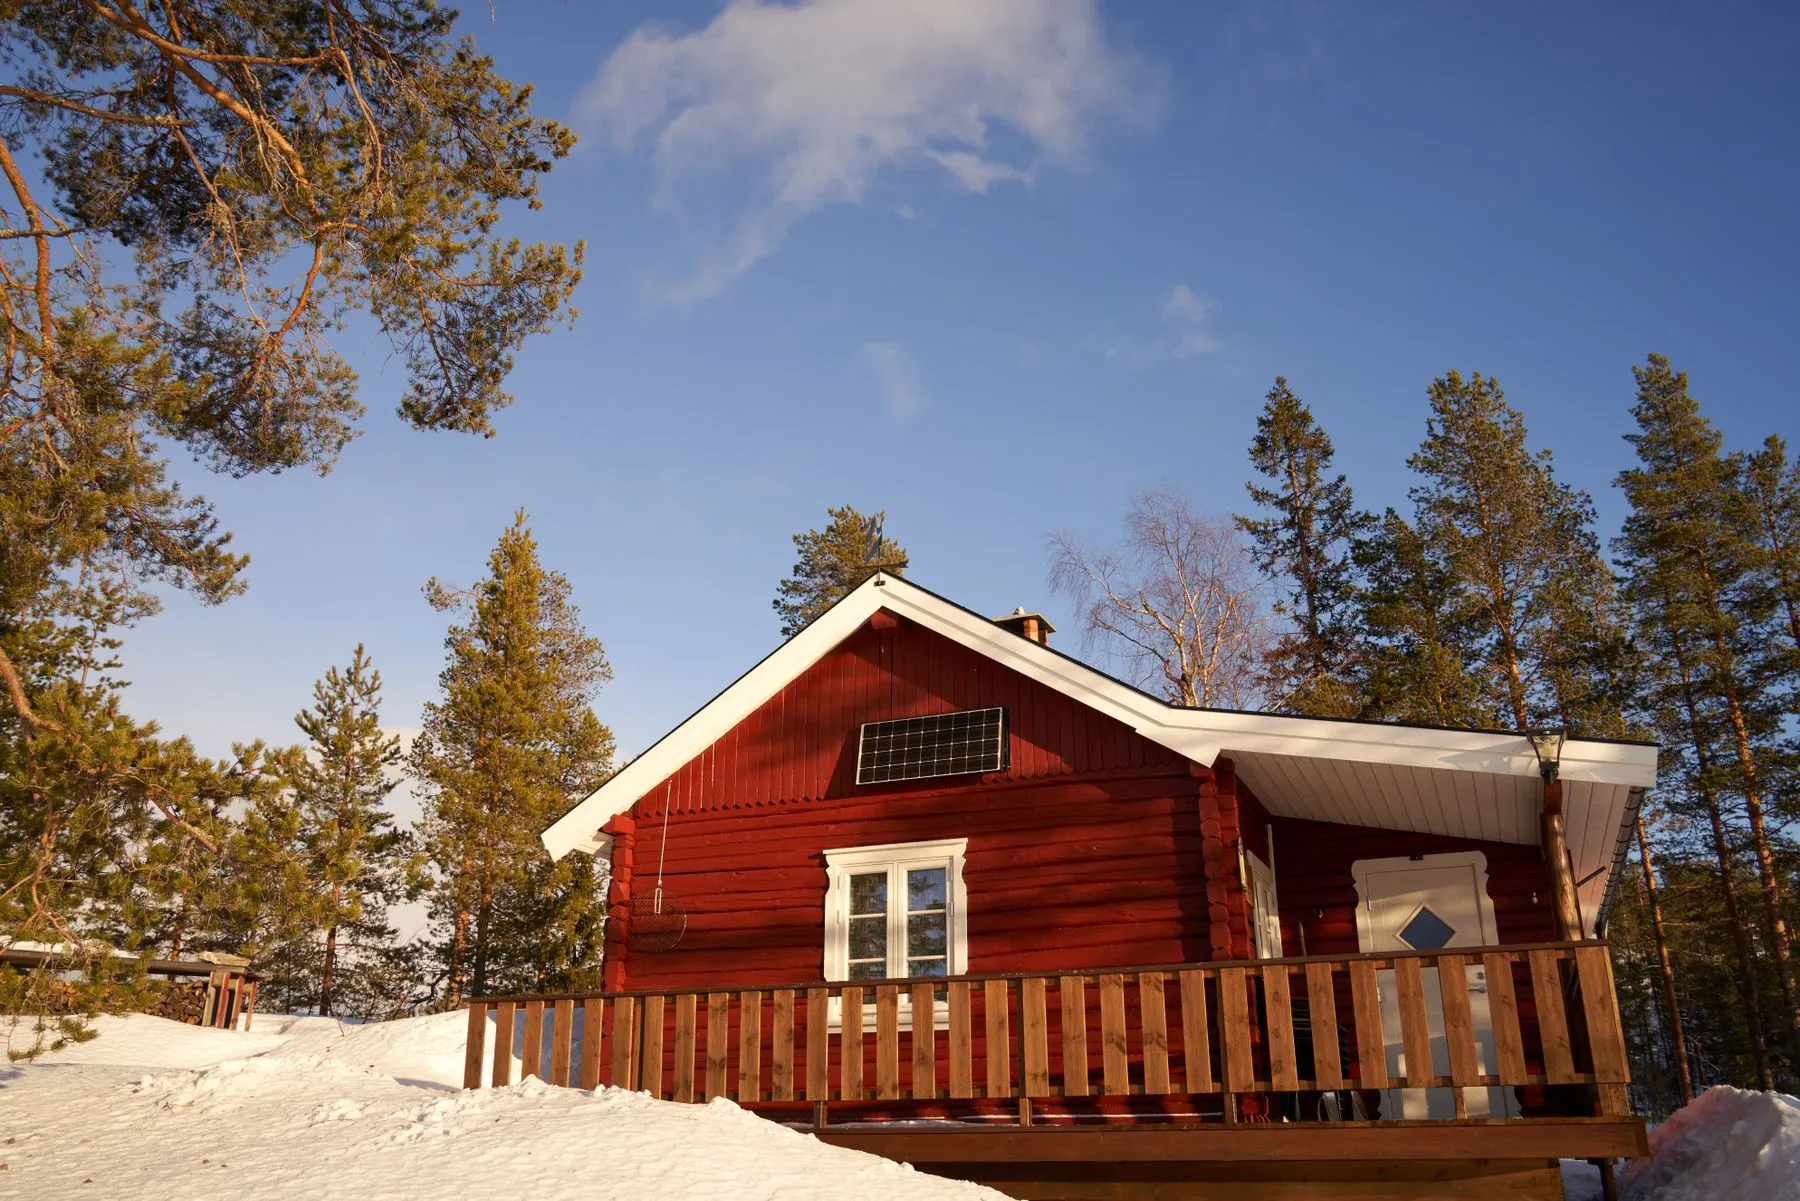
Ground mounts make winter easier. You can brush them off, set them at a steep angle and place them where winter shade is lightest, not wherever the roof happens to face.
Winter shadows are longer than you think
A site visited in summer can look open and still be shaded for most of a December day. With the sun only 22° above the horizon at noon at Idaho’s population center, a 30-foot tree casts a noon shadow about 73 feet long. At Florida’s center the same tree casts about 37 feet. Morning and afternoon shadows are far longer than that. A ridge to the south can take the low winter sun away entirely for weeks.
That is why the most useful site visit for an off-grid buyer happens in winter, or uses a shade-analysis tool that plots the sun’s winter path against the horizon. Ask a solar designer to include a shade report for December in the proposal. Our land evaluation guide lists the other questions to settle before closing.
Closing the winter gap
Very few northern off-grid homes run on solar alone in December. The common answers are:
- Oversize the array. Extra panels can cost less than the extra battery or generator runtime needed to cover the same winter shortfall. Ask designers to price both. The summer surplus is wasted, but the winter gap shrinks.
- Keep heat off the electrical system. Space heating, electric water heating and electric cooking can each exceed the whole household load in this article’s example. Wood, propane and well-insulated walls change the winter numbers more than any panel choice.
- Plan generator hours. A generator that runs a few hours a week through the darkest stretch may cost far less than doubling the array and battery. Budget for fuel, maintenance and noise rules.
- Shift and shed loads. Run the washing machine and well pump when the sun is out, and decide in advance which loads go off when the battery drops.
Getting a figure for your own site
The state figures here are a way to compare places, not a design input. For a parcel, use one of these free tools:
- NASA POWER Data Access Viewer. Choose the renewable energy community and a climatology query for your coordinates. The tilted-surface parameter gives monthly figures for flat, latitude, steeper and vertical tilts, the same data used here.
- PVWatts. It reports monthly solar radiation for an address and the tilt and direction you enter. It was built for grid-connected systems, so use its monthly radiation figures, not its annual production estimate.
Take the lowest month you intend to rely on solar, then enter it in the off-grid solar calculator. Choosing your state there fills in the December figure from this article and shows the month-by-month profile. Then subtract for the trees, ridges and snow that no satellite dataset can see.
We queried the NASA POWER climatology API (v2.10.1, renewable energy community) for parameter SI_EF_TILTED_SURFACE at each state’s 2020 Census center of population on October 17, 2026, and used the latitude-tilt monthly and annual averages for 2001–2025. Rankings compare those 50 points. Values describe average conditions and will differ from any single year. The full monthly series for each state is used in the calculator, and the annual and December figures are in the CSV.
Questions readers ask
What state gets the most sun for off-grid solar?
On an annual average at the center of population, Arizona leads with 6.5 peak sun hours a day on a panel tilted at latitude. In December, the month an off-grid system is usually sized for, Hawaiʻi leads with 5.0 hours, followed by New Mexico and Arizona.
How many peak sun hours do I need for off-grid solar?
There is no minimum; fewer sun hours just mean a bigger array, more battery or a backup generator. Size the array to the worst month you intend to rely on solar. A home using 5 kWh a day needs roughly 1.3 kW of panels at 5 winter sun hours and about 3.3 kW at 2 hours, using a 75% delivery factor.
Are peak sun hours the same as hours of daylight?
No. A peak sun hour is one kilowatt-hour of solar energy per square meter, the energy a panel would receive in one hour of full midday sun. A winter day with nine hours of daylight may deliver only two peak sun hours because the sun is low and often behind cloud.
Why are my local numbers different from this table?
The table uses one point per state, the 2020 Census center of population, so it describes where most residents live. Mountains, coasts, valleys with winter inversions and high deserts can differ by more than an hour a day. Use NASA POWER or PVWatts for your coordinates.
Does a steeper tilt help in winter?
A little. In NASA’s data, tilting panels 15 degrees steeper than latitude raised December output by a median of about 6% over a latitude tilt. The bigger losses come from mounting panels flat: a horizontal panel received a median of about 60% of the December energy of a latitude-tilted one.
Sources
Official and primary sources consulted for this article, checked October 17, 2026. Laws change; open the source before relying on a summary.
- POWER Climatology API: monthly and annual averages, parameter SI_EF_TILTED_SURFACE — NASA Langley Research Center, POWER project. Retrieved October 17, 2026 for each state’s 2020 center of population; 2001–2025 averages
- NASA POWER: Prediction Of Worldwide Energy Resources — NASA Langley Research Center
- 2020 Centers of Population by State — US Census Bureau
- Centers of Population: about the data — US Census Bureau
- PVWatts Calculator — National Laboratory of the Rockies (formerly NREL)
- Solar position and the declination of the sun — NOAA Global Monitoring Laboratory, Solar Calculator
Keep reading
- Tiny house laws by state: Appendix Q, wheels and the 400-square-foot line
- Counties without building codes: what “no code” really means
- Rank all 50 states on the factors that matter to you
- Find the authorities and starting rules for your state
Articles are reported from official statutes, regulations, agency guidance and public datasets, linked above. They explain how rules work; they do not approve a particular property. Read the research method or report an error.